(214) 272-7034
  info@fasthippomedia.com



Impressions holding steady while clicks fall is now the most common shape in a small business Search Console account, and the honest first thing to say about it is that Google does not give you a number for the cause. AI Overview appearances are folded into your ordinary web search data. That does not make the situation unmeasurable. It changes which numbers are worth putting in a report, and it makes a few of them worth more than they used to be.
TL;DR
Google’s documentation states that sites appearing in AI features are included in overall search traffic in Search Console, reported in the Performance report under the Web search type. So there is no separate AI Overview line to point at. Independent research from Pew Research Center measured what changed: users who saw an AI summary clicked a result link on 8 percent of visits, against 15 percent for users who did not. Reporting that survives this shift stops leading with clicks, leads with impressions and position by query, and adds the things AI features actually respond to.
Where Does AI Overview Traffic Show Up?
In your existing numbers, which is the part that makes it hard to see.
Google’s guidance on AI features and your website is explicit. Just like the rest of the search results page, sites appearing in AI features such as AI Overviews and AI Mode are included in the overall search traffic in Search Console, and in particular they are reported on in the Performance report within the Web search type.
That single sentence settles several arguments at once.
There is no separate report. No filter isolates AI Overview impressions. And an agency promising to show you an AI Overview traffic line as a distinct number is describing something the platform does not currently expose.
What the same document says about setup
Two other lines from that page are worth quoting in any conversation about AI search, because a lot of money gets spent against them.
You do not need to create new machine-readable files, AI text files, or markup to appear in these features. There is also no special schema.org structured data that you need to add.
That is Google, in its own documentation, in its own words. It is the answer to most of what is currently being sold as AI optimisation.
What Actually Changes in the Numbers?
For that, you need research rather than a platform statement, because the platform is not going to publish how much its own feature costs publishers.
Pew Research Center ran the study that answers it. Its analysis used the browsing data of 900 US adults who agreed to share their online activity, covering searches in March 2025.
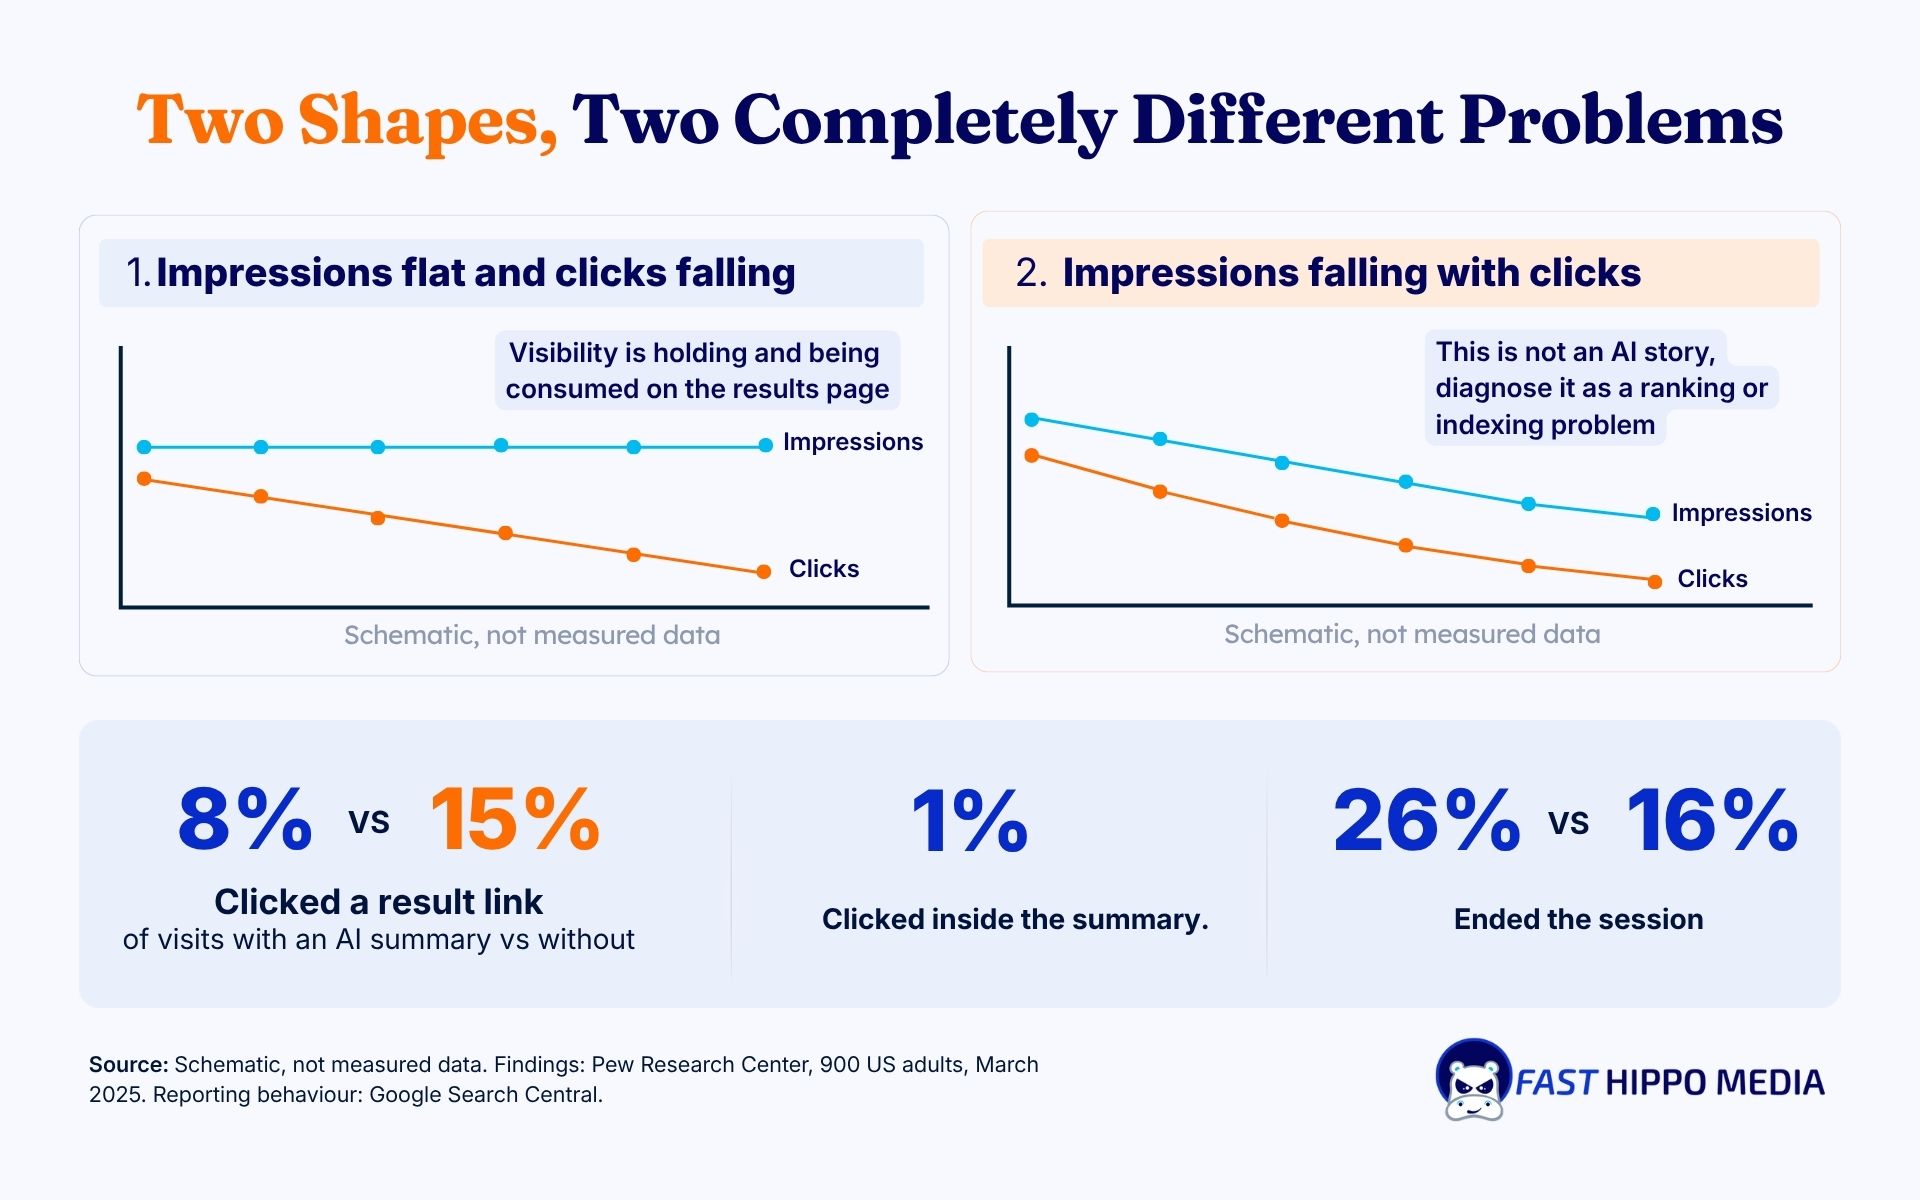
The headline finding is the one to put in a report. Users who encountered an AI summary clicked a traditional search result link on 8 percent of visits. Users who did not encounter one clicked on a search result nearly twice as often, on 15 percent of visits.
Two further numbers matter for expectations. Users clicked a link inside the summary itself on just 1 percent of visits to pages with a summary. And browsing sessions ended entirely on 26 percent of pages carrying an AI summary, against 16 percent of pages with only traditional results.
How often this is even happening
Less often than the industry conversation implies, which is useful context for a nervous client.
In the Pew study, 18 percent of all Google searches generated an AI summary, so roughly one in five. Fifty-eight percent of respondents ran at least one search in March 2025 that produced one.
Query length is the strongest visible driver. Longer searches are more likely to produce an AI summary, and just 8 percent of one- or two-word searches did.
That last point has a direct operational consequence. A business ranking mainly for short, local, high-intent phrases is exposed to far less of this than a business ranking for long informational questions, and the same monthly report should not treat those two situations the same way.
So What Goes in the Report?
Five things, and the order is deliberate because it moves the lead away from a number that is now measuring something different.
Impressions by query, with position: This is now the most honest indicator of whether the work is landing. If impressions and position are improving while clicks are flat, the visibility is being earned, and it is being consumed on the results page. That is a real result, and it needs saying rather than hiding.
Click-through rate by query, tracked over time: Not as a performance score, but as a diagnostic. A CTR that falls on informational queries while holding on commercial ones is the signature of exactly the effect Pew measured, and it separates that from a genuine ranking loss.
Query mix: What share of impressions come from short, local, commercial phrasing versus long informational questions. This is the exposure measurement, and it is derivable from the same export.
Conversions and engaged sessions: Google’s own documentation says that in addition to Search Console, you could track conversions and time spent on your site in other tools, and states that when people click from results pages with AI Overviews, those clicks are higher quality, meaning users are more likely to spend more time on the site. If fewer visits are each worth more, a report that counts only visits gets the direction of travel wrong.
Branded search volume: The number of people who check least and the one that moves when a business becomes the answer rather than the link. Somebody who read the summary and then searched the business name is a result that no click metric on the original query will ever attribute.
What Nobody Can Honestly Promise
Worth being direct about, because this is where the current market is at its worst.
Nobody can show you how many times your site appeared in an AI Overview. The platform does not report it separately, and any dashboard claiming that figure is estimating it from sampled scrapes rather than reading it from Google.
Nobody can guarantee inclusion in an AI answer. The same is true of a featured snippet and always has been, and the honest framing has not changed.
And nobody can sell you a file or a markup type that gets you in, because Google’s documentation says no new files, no AI text files, and no special structured data are required.
What can be promised is the work that has always applied: pages that answer the question directly, content that is genuinely worth citing, technical health, and a site verified in Search Console so problems can be diagnosed at all. Our note on how SEO, AEO and GEO compound covers the production side of that.
A Worked Example of the Wrong Conclusion
The clearest way to show why the order of these numbers matters is to walk one through.
A service business publishes twenty informational articles over two years. They rank. Traffic grows. Then over about six months the sessions from those articles halve, while the money pages hold steady. The monthly report leads with total organic sessions, which are down sharply, and the obvious conclusion is that the content programme stopped working.
Now run the sequence. Impressions on those articles are flat or up. Average position is unchanged. The queries that lost clicks are the long, question-shaped ones, and the short local ones are untouched. Enquiries are the same as last year, or slightly up.
Nothing about that picture says the content failed. It says the content is being read in a place that does not generate a session, on exactly the query shape Pew found is most likely to produce a summary, while the commercial half of the site is unaffected.
The wrong conclusion costs real money here, because the response to “the content stopped working” is usually to stop producing it or to rewrite pages that are performing.
The version where something genuinely is wrong
The same shape with one number changed means something completely different.
If impressions fell alongside clicks, this is not an AI story at all. Something moved in rankings, or in indexing, or a competitor took the position. That gets diagnosed the way it always did, and treating it as an inevitable AI effect is how a fixable problem gets accepted as weather.
That is the entire value of splitting impressions from clicks before anything else. It is the one comparison that tells you which of two very different problems you have, and most reports lead with a metric that blends them.
What This Does Not Change
Worth saying, because the volume of noise on this subject implies more upheaval than the evidence supports.
The technical work is unchanged. Google’s documentation says AI features need no new files, no AI text files, and no special structured data, and that verifying in Search Console is how to find and diagnose technical issues. Crawlability, speed, correct canonicals, and clean information architecture all still do exactly what they did.
The content standard is unchanged, and if anything it is higher. A summary that cites three or more sources in the overwhelming majority of cases is a summary choosing between pages, and it chooses pages that answer the question specifically.
The local picture is largely unchanged. Short, place-based, high-intent queries produce summaries far less often, which is most of what a service business ranks for.
What changed is the reporting, and only the reporting. That is a smaller and more manageable problem than the market is currently pricing.
How to Read a Drop Without Panicking
A sequence, because the wrong conclusion here costs real money in unnecessary rebuilds.
Start by separating impressions from clicks. If impressions are down, this is not an AI Overview story; it is a ranking or an indexing story, and it should be diagnosed as one.
If impressions are stable or rising while clicks fall, split the queries. Look at what happened to the long informational ones against the short commercial ones. Pew’s finding on query length predicts that the informational half absorbs most of the change.
Then look at what the remaining traffic does. If sessions per visit are shorter and conversions are down proportionally, something else is wrong. If conversions hold or improve on fewer sessions, the traffic composition has changed rather than degraded, which is consistent with what Google reports about click quality.
Only then decide whether anything needs fixing. A page that lost half its clicks and none of its enquiries has not failed, and rewriting it because a chart went down is how good pages get broken.
The comparison that misleads people most
Year-on-year click comparisons across this transition are close to meaningless, and they are the default view in most reporting tools.
The results page changed underneath the measurement. Comparing this September against last September is comparing two different products, and the number will look bad in cases where the underlying visibility improved. Either annotate it heavily or lead with a metric that is measuring the same thing in both periods.
What This Means for a Small Business
The practical read, stripped of the industry noise.
If your customers find you by searching a service and a town, most of your queries are short, and most of them do not produce an AI summary at all. Your exposure to this is low, and anyone selling you an urgent AI rescue package should be asked to show your query mix first.
If your traffic comes from informational content, from questions and guides, your exposure is high, and the shape of the report has to change. The content still works. It is being read in a different place, and it now pays off through brand searches, direct visits, and a smaller number of better visits.
The diagnosis comes from the same export either way, and it takes an afternoon rather than a platform. That is the practical difference between reporting and dashboard theatre, and it is the same argument we make about measuring local visibility properly.
Read the Search Console Export Before Buying Any AEO Package
The next time a report shows clicks falling, the first question is not what to fix. It is which queries moved, how long they are, and what the impressions did while the clicks fell. Those three answers come out of one Search Console export, and between them they tell you whether you are looking at an AI Overview effect, a ranking loss, or a seasonal dip that would have happened anyway.
Fast Hippo Media builds reporting around what can actually be measured, and if your numbers have gone strange this year, we can pull the export and read it with you rather than sell you a package against a number nobody can see.
Frequently Asked Questions
Not separately. Google’s documentation states that sites appearing in AI features are included in overall search traffic and reported in the Performance report within the Web search type. There is no isolated AI Overview line, and any tool showing one is estimating it.
Pew Research Center’s study of 900 US adults found that users who encountered an AI summary clicked a traditional result link on 8 percent of visits, compared with 15 percent for users who did not see one. Clicks on links inside the summary happened on 1 percent of visits.
No. Google’s own documentation says you do not need to create new machine-readable files, AI text files, or markup, and that there is no special schema.org structured data required for these features.
In the Pew study, 18 percent of Google searches generated one, and just 8 percent of one- or two-word searches did. Longer searches produce them more often, so a business ranking for short local phrases is far less exposed than one ranking for long questions.
Impressions and average position by query should be read alongside conversions rather than sessions. Google reports that clicks from results pages with AI Overviews are higher quality, with users more likely to spend more time on the site, so a falling session count with steady conversions is a change in composition rather than a loss.